How to use it
A stack-up is a loop. You walk from one side of the gap you care about, through every feature that controls it, and back again. Each feature either opens the gap or closes it.
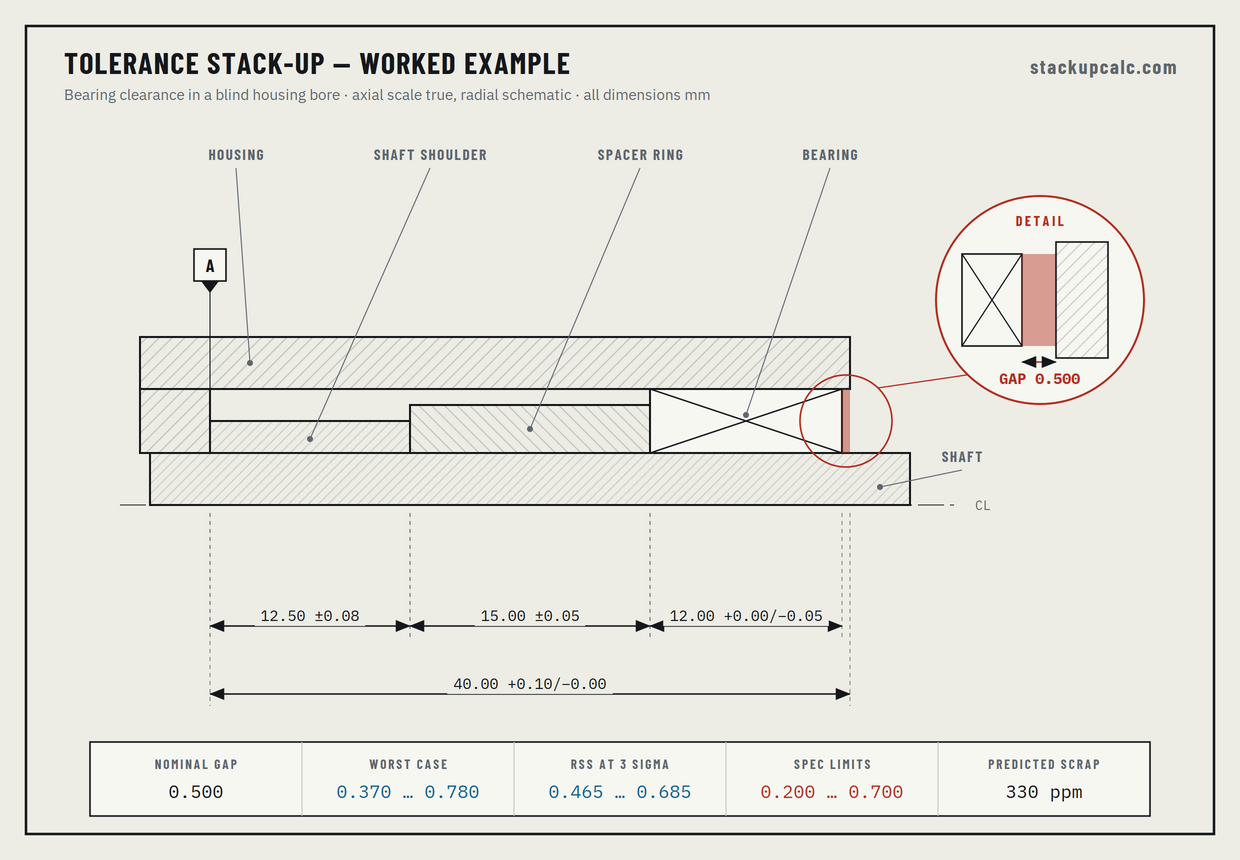
- Set the direction to
+for features that open the gap — a housing bore, a slot width, an overall length. - Set it to
−for features that consume it — a bearing, a spacer, a shoulder, a boss. - Enter the nominal size and the upper and lower deviations exactly as the drawing states them —
+0.10/−0.00,−0.007/−0.020, or+0.015/+0.002. Asymmetric values shift the mean off nominal, and the calculator accounts for that. - Or pick an ISO 286 fit from the dropdown and the deviations fill in for you. Holes D–H and shafts d–h, k–p, grades IT5–IT12, sizes 1–500 mm.
- Switch between millimetres and inches in the header. Values convert rather than just relabelling, so an existing chain stays the same physical design.
- Set the spec limits on the resulting gap. Leave either one blank to ignore it.
If the nominal gap comes out negative, your direction signs are inconsistent — walk the loop again.
Worst case or RSS?
This is the argument that shows up in every design review, and both sides are usually half right.
Worst case
Assumes every part arrives at its worst limit simultaneously. It is arithmetic, not statistics: add the tolerances. Nothing you build can ever fall outside the range it predicts, which is why it is the right method for safety-critical clearances, interference conditions, and anything where a single failure is unacceptable.
The cost is that it is pessimistic to the point of being misleading. With eight features in a chain, the probability of all eight simultaneously landing at the same extreme is vanishingly small — and designing for it means paying for tolerances you will never need.
RSS
Root-sum-square takes the square root of the summed squared tolerances. Because errors partially cancel, the predicted spread is much narrower — typically 40–60 % of worst case on a chain of four or more features. That difference is real money in machining cost.
RSS is only valid if its assumptions hold. Independent processes, roughly centred, roughly normal, and enough features for the cancellation to actually happen. Break any of those and RSS will quietly under-predict your scrap rate.
Where RSS goes wrong
- Two or three features only. There is not enough averaging for the statistics to help. Use worst case.
- Shared processes. Two dimensions cut in the same setup on the same machine are correlated, not independent. Their errors move together rather than cancelling.
- Off-centre processes. RSS assumes production sits at the middle of the tolerance band. A supplier machining consistently to the high side breaks that immediately.
- One dominant contributor. If a single tolerance is most of the variance, cancellation barely occurs and RSS converges back toward worst case anyway.
The contributor breakdown in the results panel exists for that last case. If the top row is above roughly 50 %, tightening it is the only change that will move the result — and everything else you tighten is wasted money.
What the numbers mean
| Output | Reading it |
|---|---|
| Nominal gap | The gap with every feature exactly at its stated size. A design intent value, not something you will measure. |
| Worst case | The absolute bounds. Nothing can fall outside this, however unlikely the combination. |
| RSS | The statistical spread at the chosen sigma band. Assumes independent, centred processes. |
| Predicted scrap | Parts per million falling outside your spec limits. Roughly 2 700 ppm corresponds to a ±3σ process exactly filling the band. |
| Cpk | Process capability including any off-centre shift. 1.33 is a common minimum, 1.67 for critical features. Below 1.0 you are shipping defects. |
| Contributors | Share of total statistical variance. Because variance goes as the square, the largest tolerance dominates far more than it looks. |
Assumptions and limits
Worth knowing before you put a number from here into a drawing package:
- Tolerance bands are treated as ±3σ by default. If your supplier runs ±4σ or ±6σ capability, change the setting in the title block — it materially changes the predicted scrap rate.
- Features are assumed statistically independent. Parts from the same setup, same fixture or same batch usually are not.
- This is a one-dimensional analysis. Geometric tolerances that contribute at an angle, plus the bonus tolerance available at MMC, are not modelled here.
- Monte Carlo runs 24 000 builds from a fixed seed, so results are repeatable rather than shifting each time you edit a field.
- The predicted scrap rate is computed analytically from the fitted distribution rather than counted from the samples, which keeps very low ppm figures meaningful.